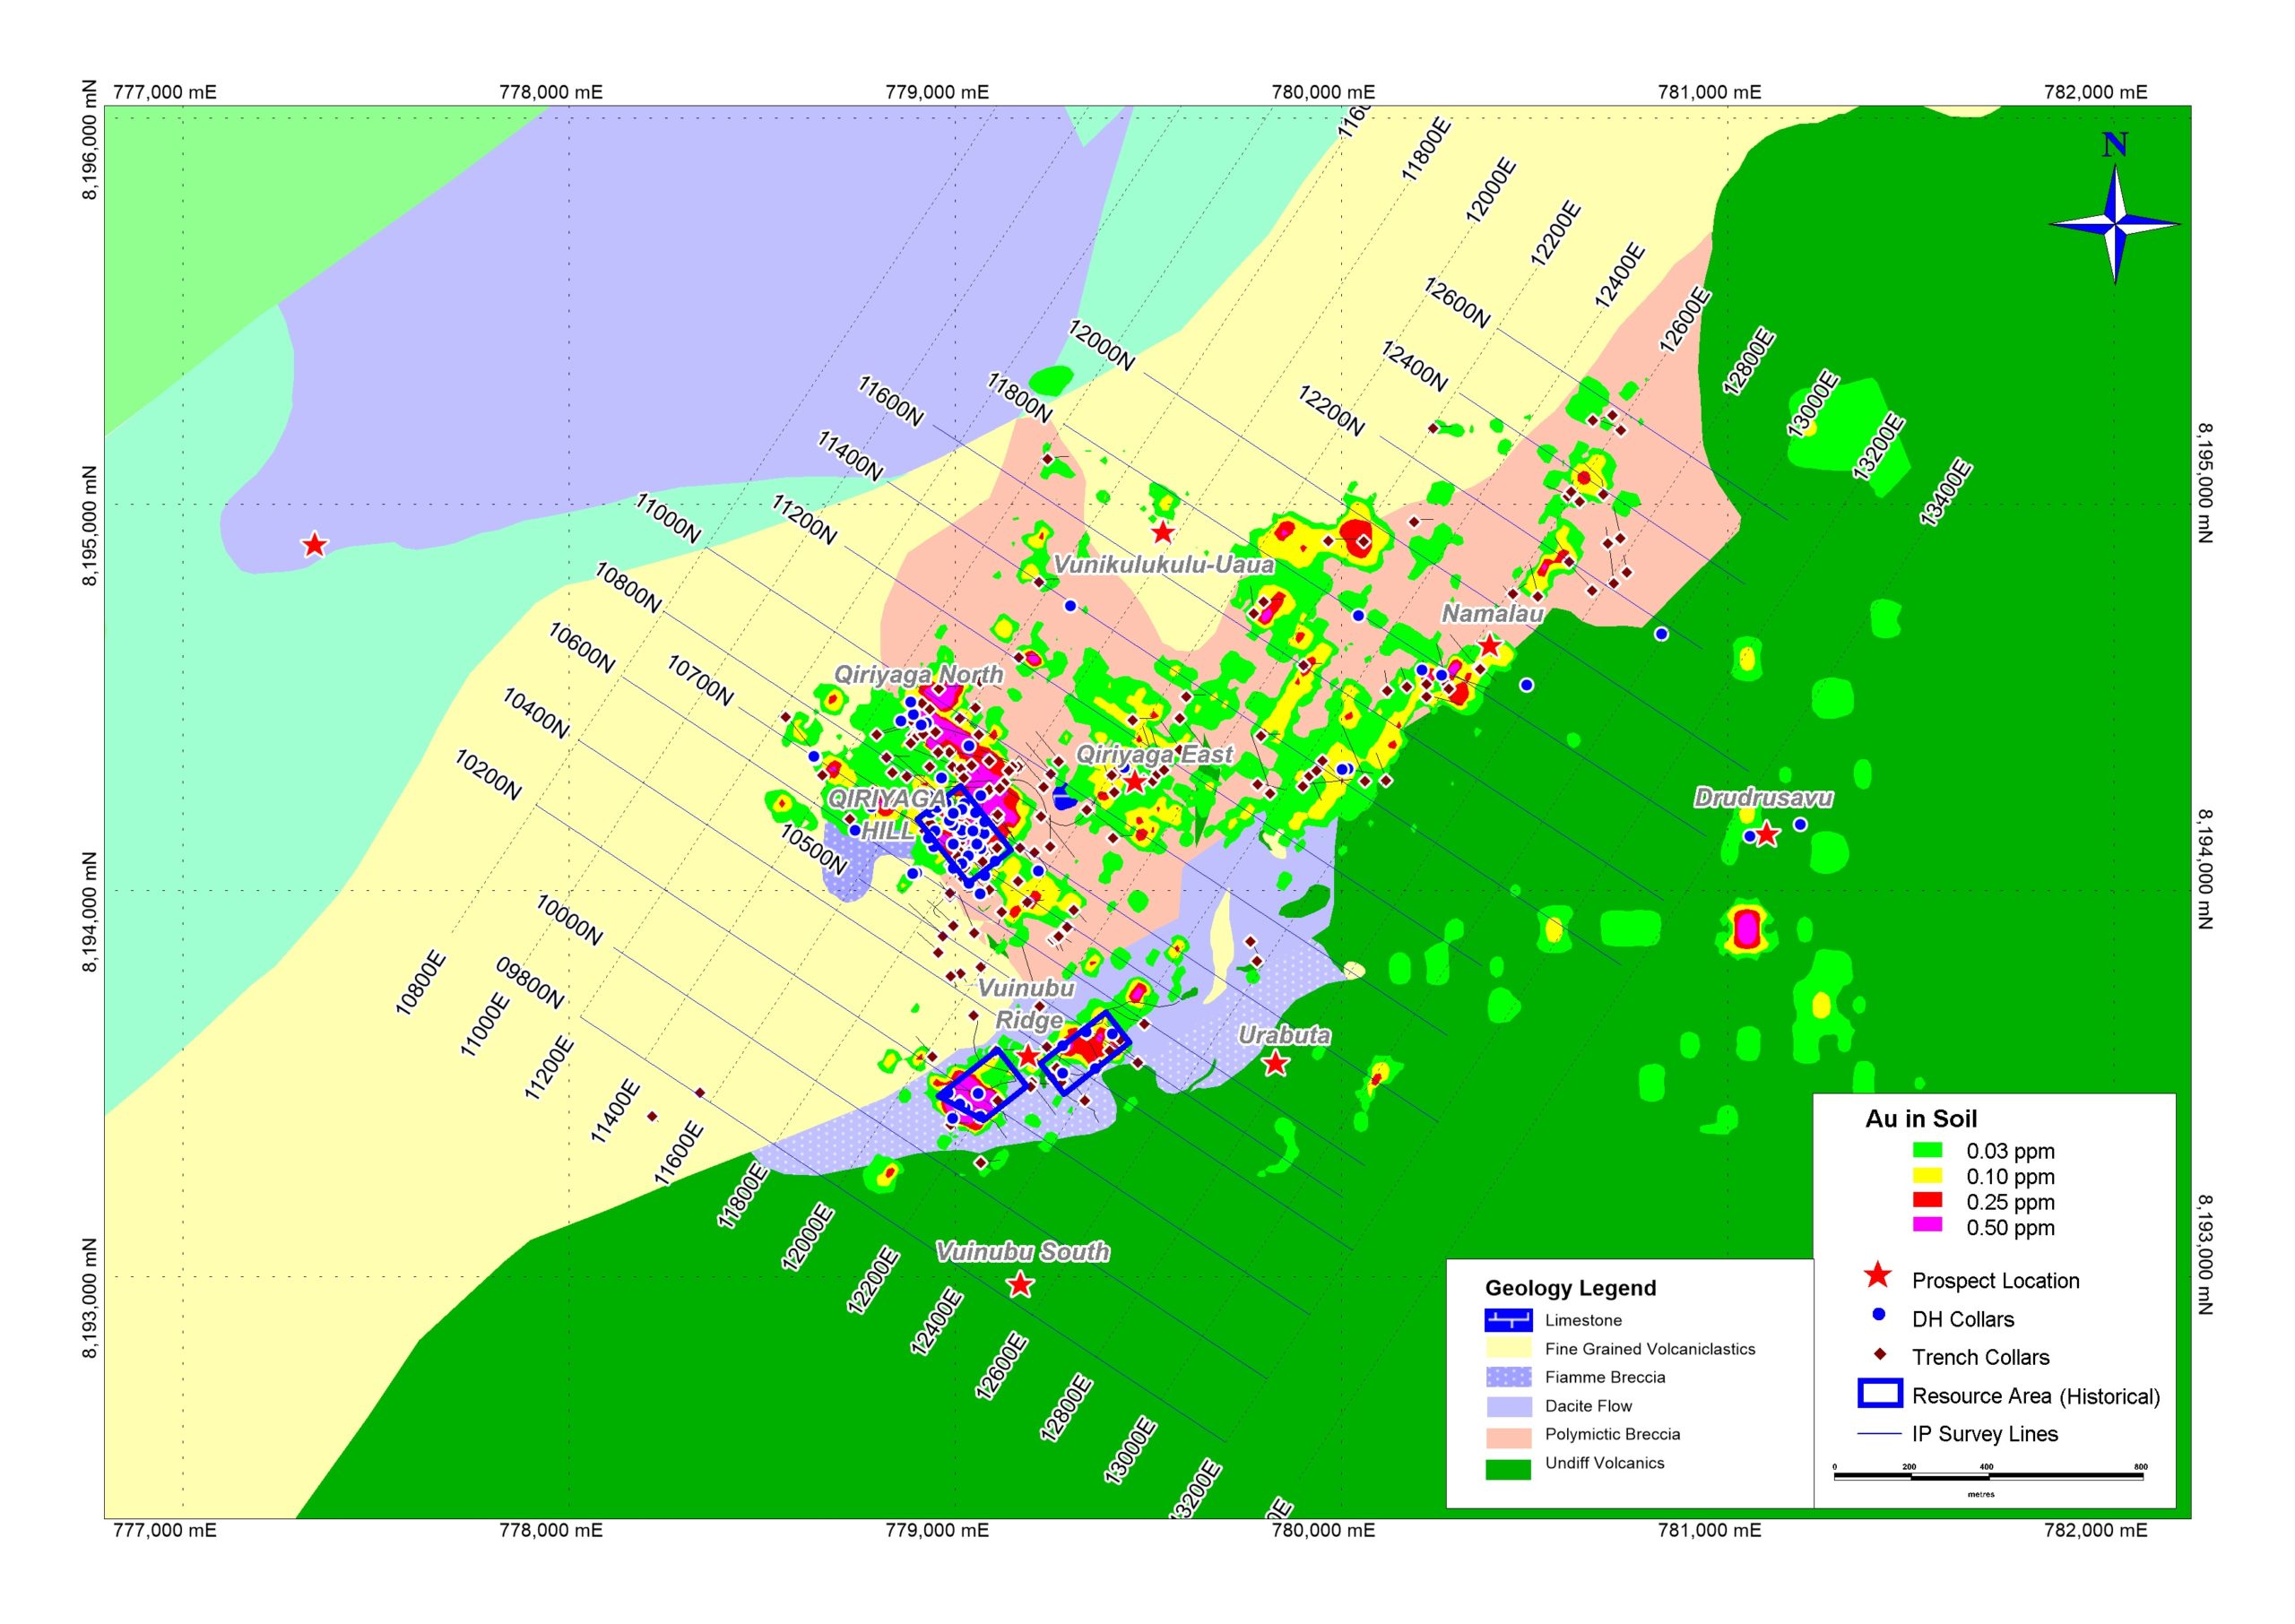
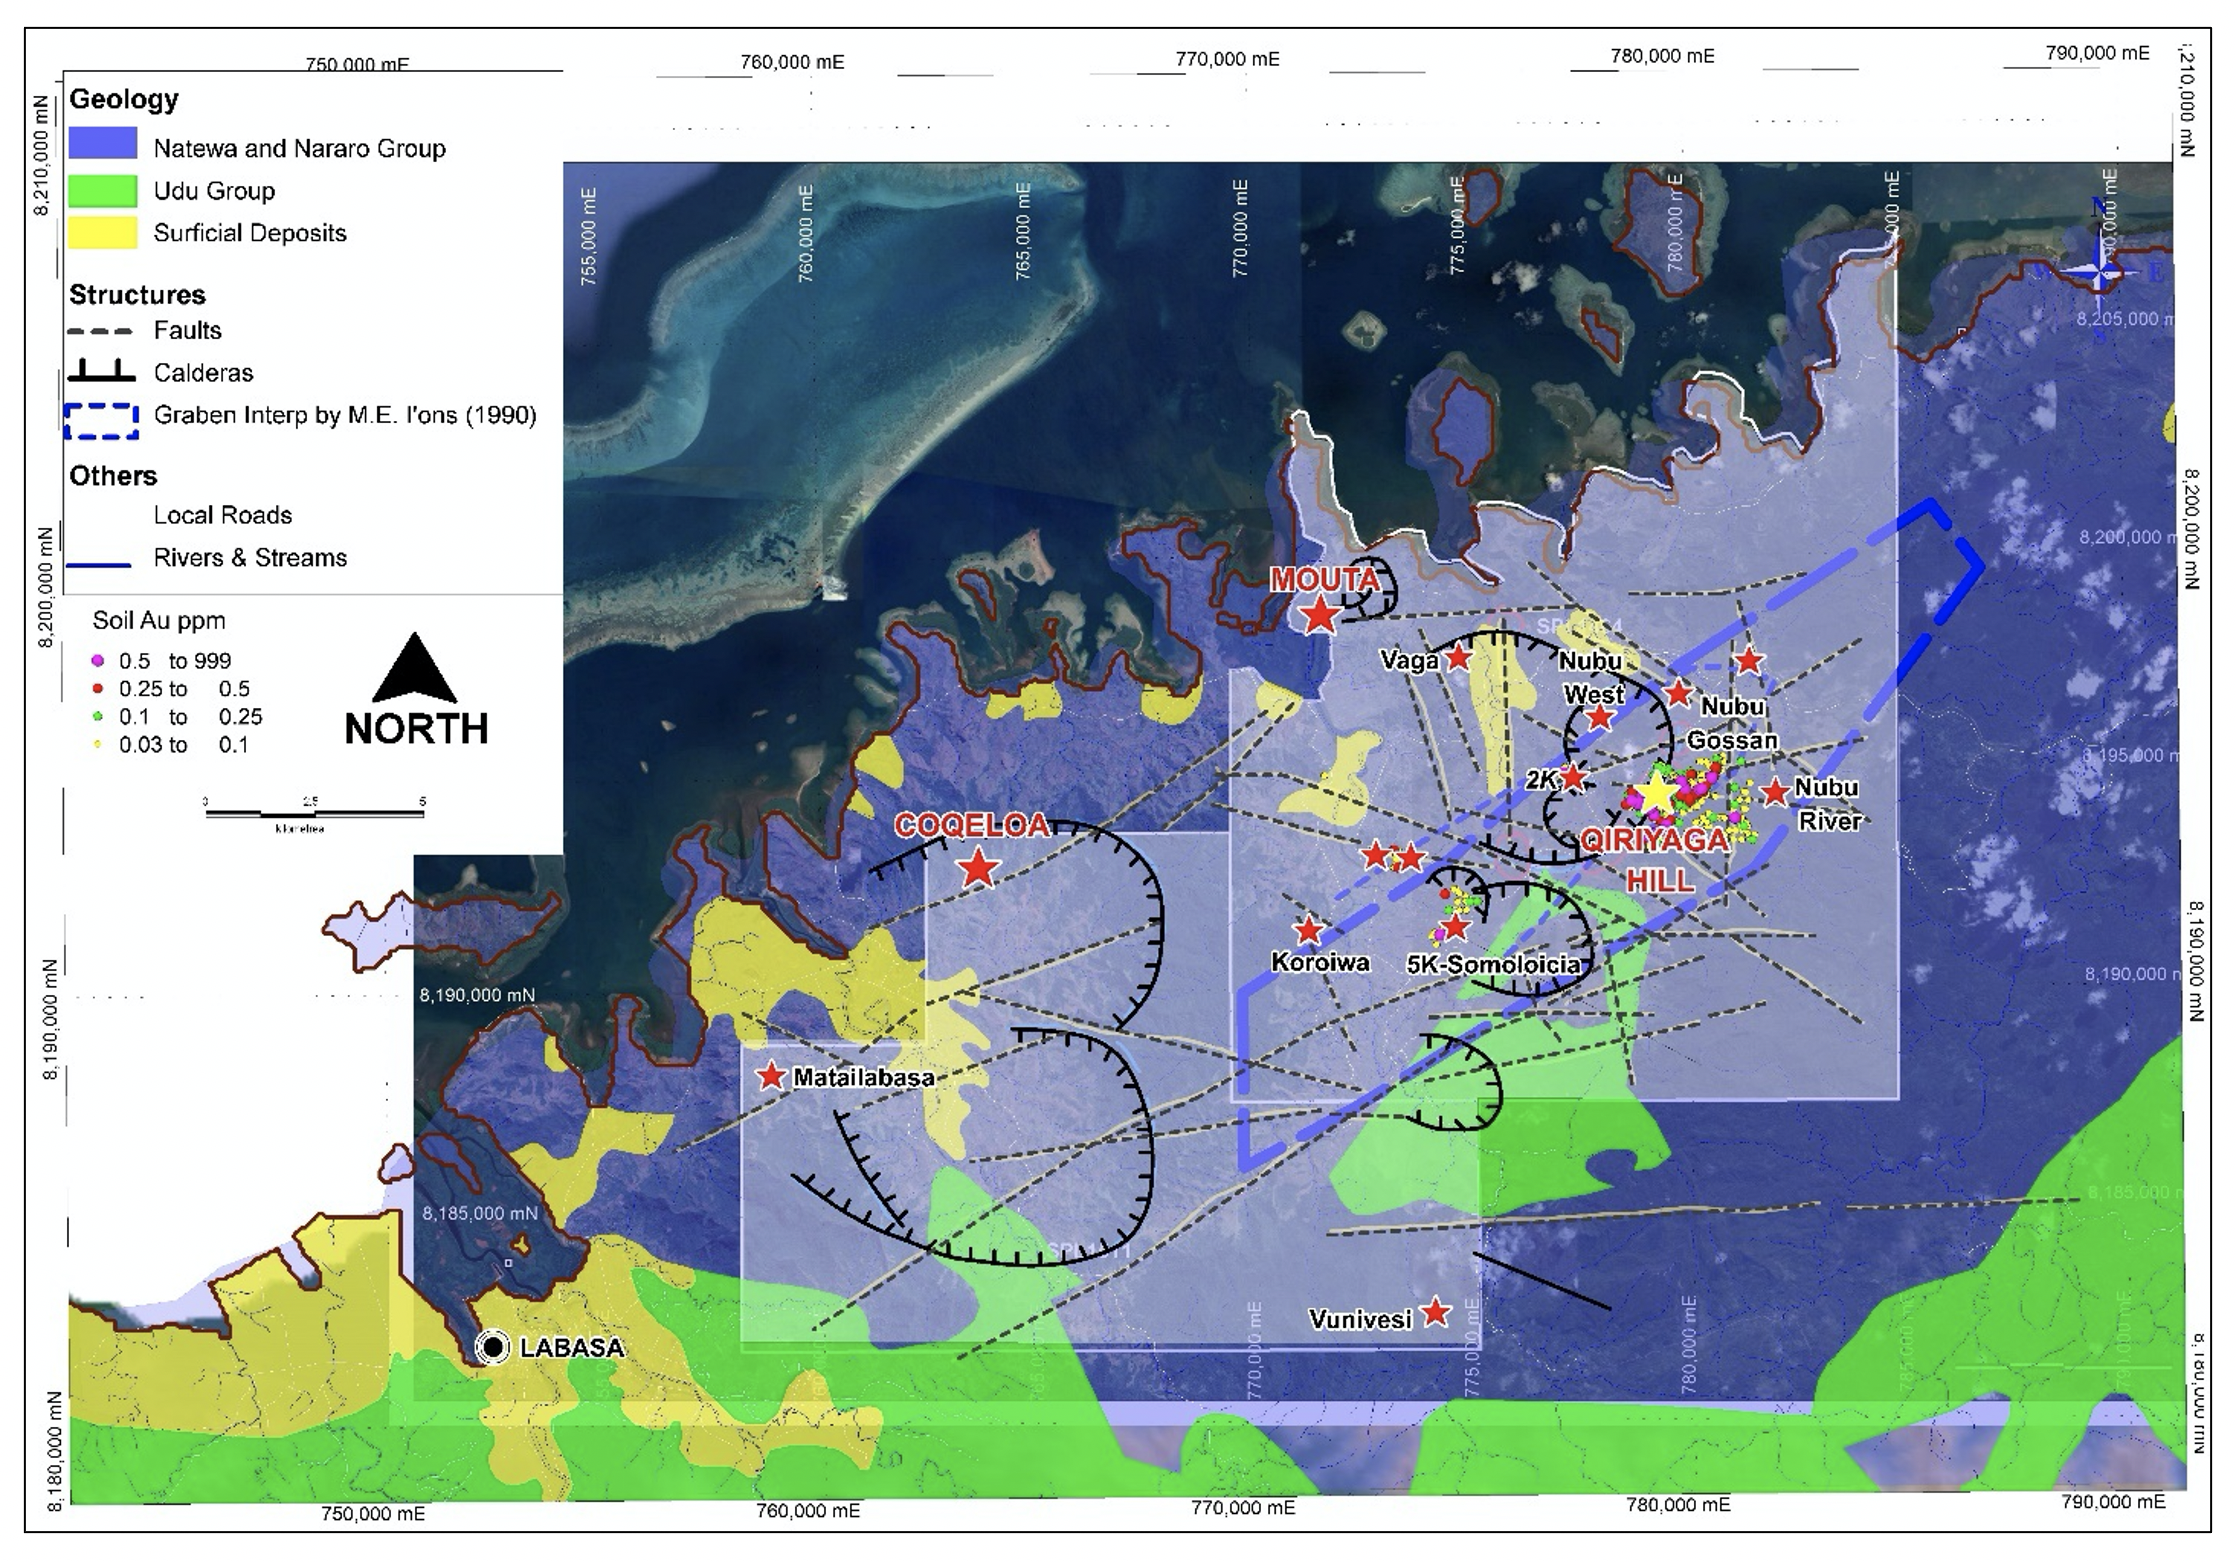
Map showing modelled IP chargeability and Au soil geochemical map. The contour lines (grey lines) are 5m elevation contours
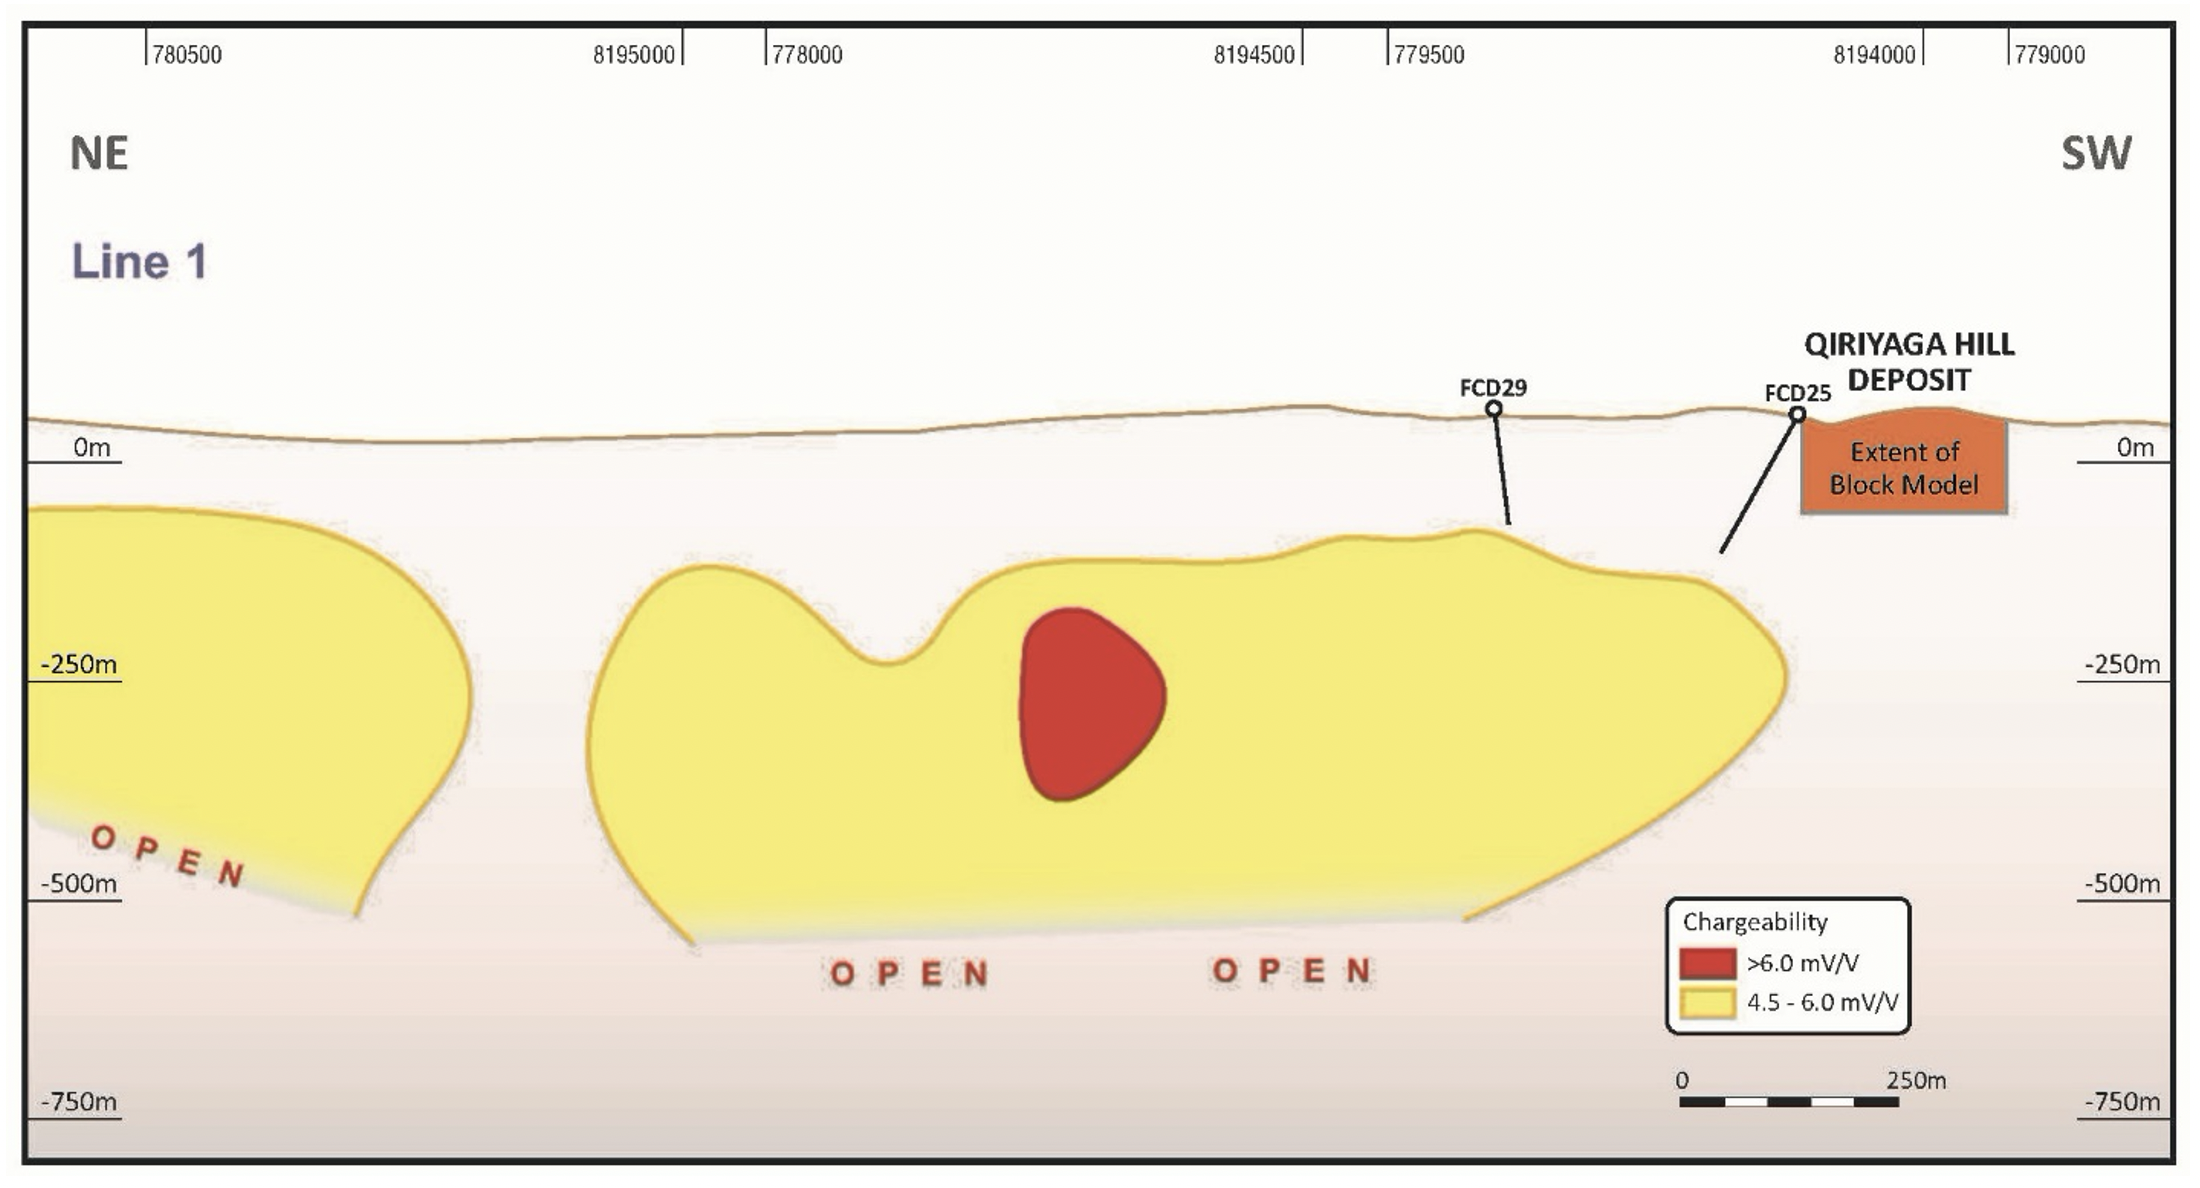
Section along Line 1 looking southeast. Extent of block model on Qiriyaga Hill shown on the upper right side is historical
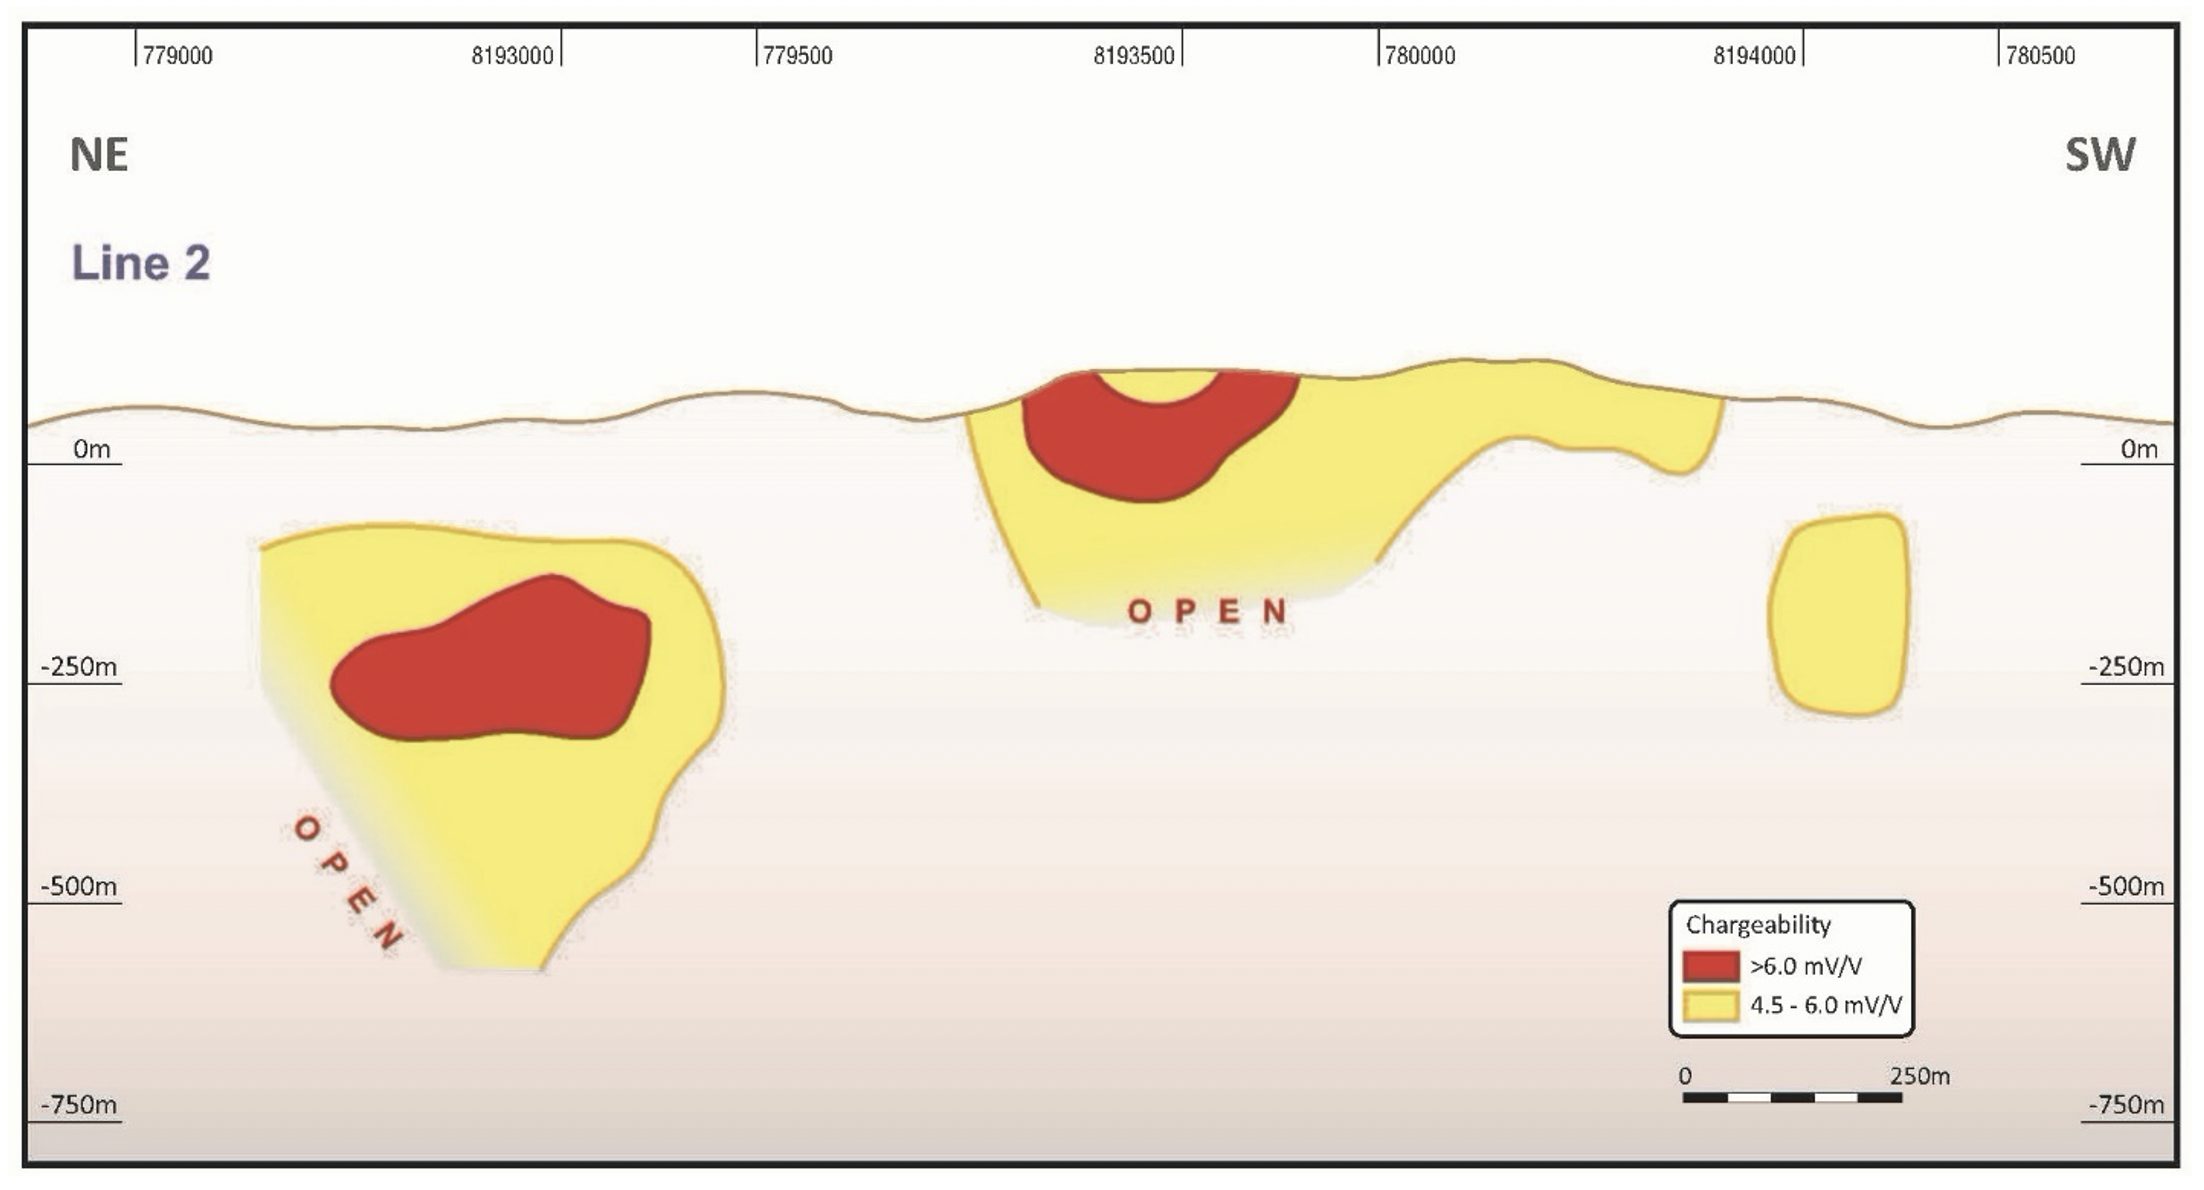
Section along Line 2 looking northwest. No drilling has been undertaken in this part of the Qiriyaga mineralized trend
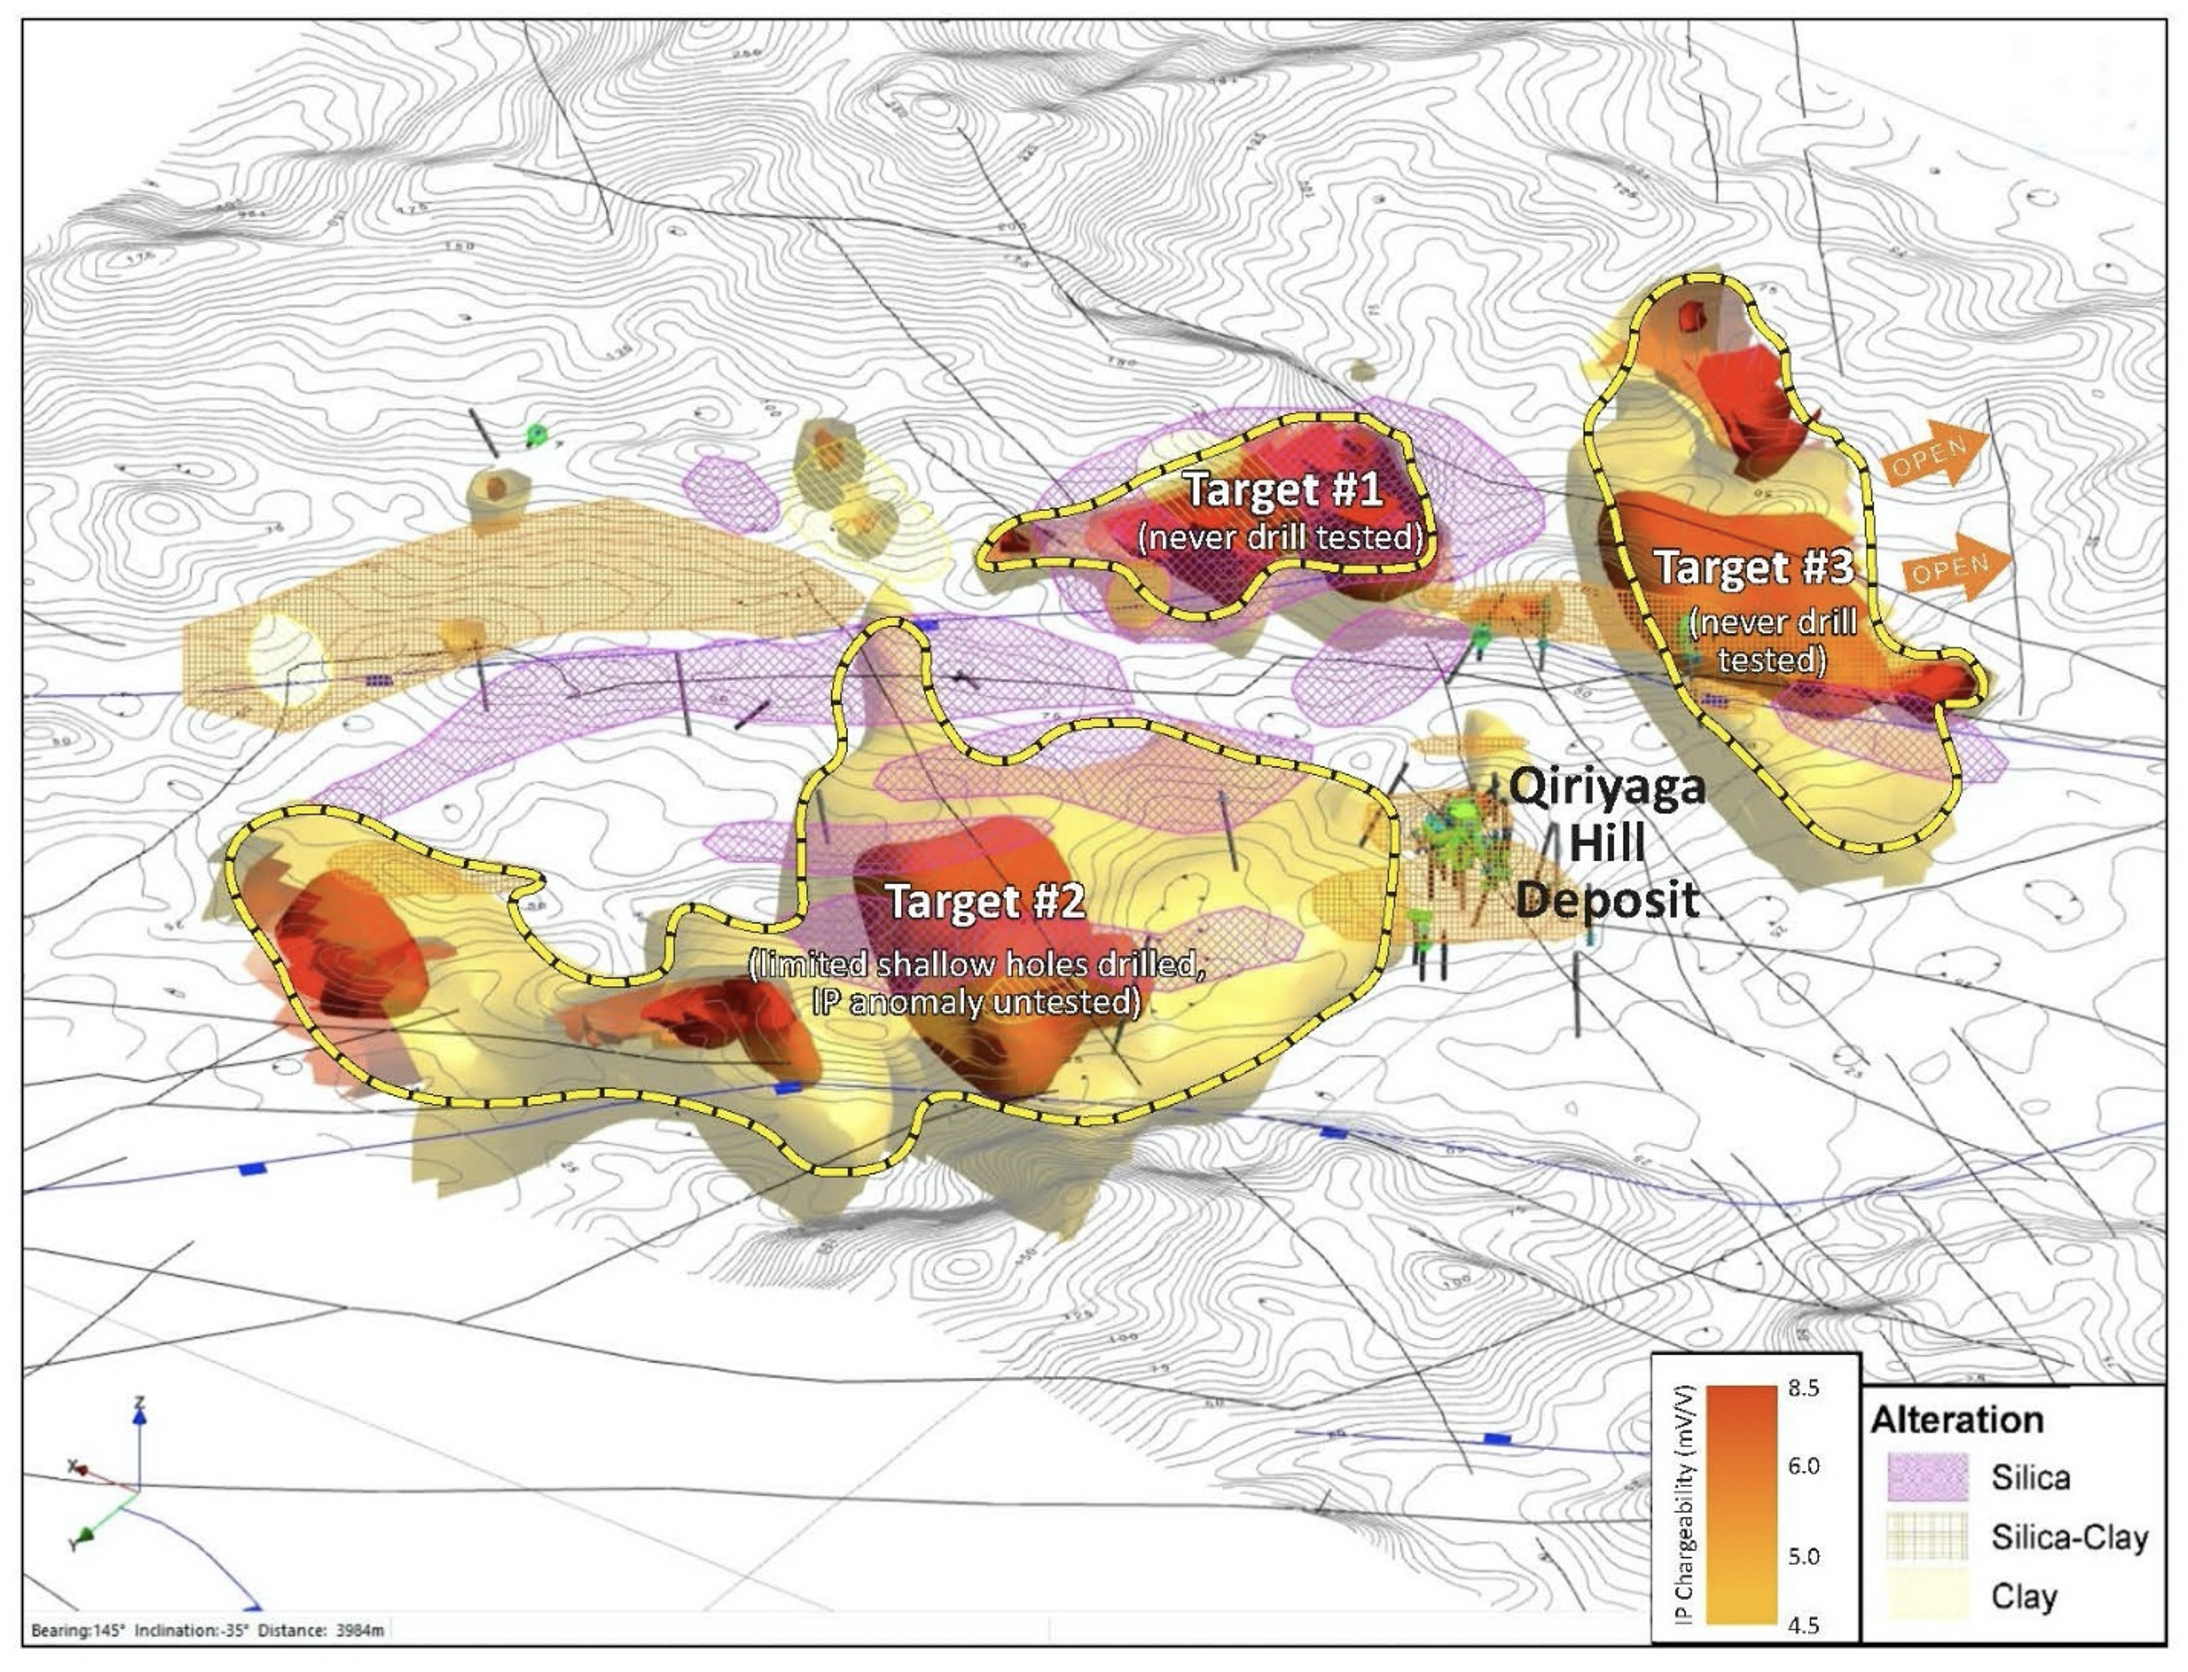
3D model showing IP chargeability and alteration zones - viewed looking SE (bearing 145 deg) at -35-degree angle
